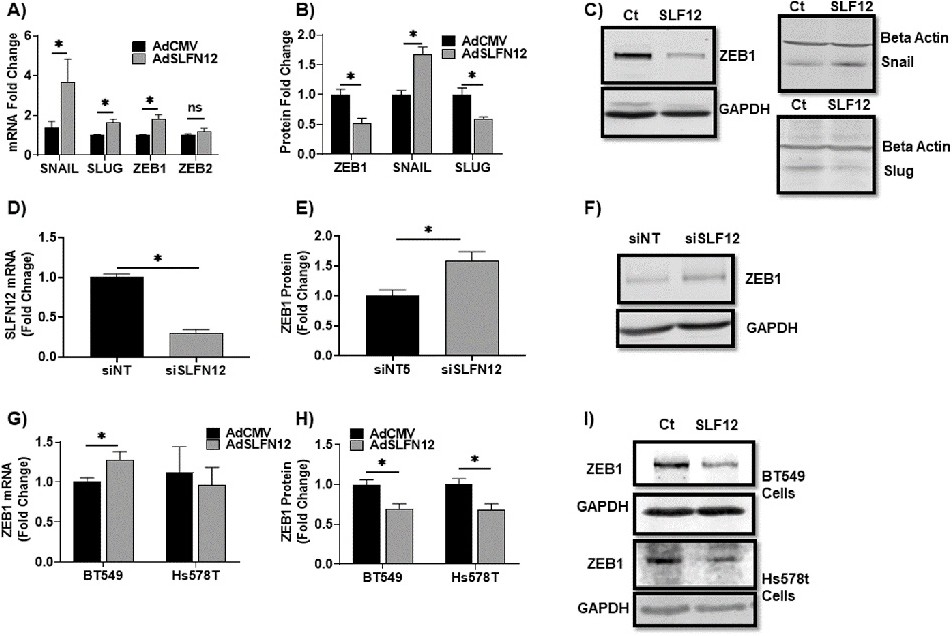
Fig. 5. Schlafen12 modulates ZEB1 levels. A) SYBR Green qPCR analysis of mRNA levels of Snail (n=9), Slug (n=9), ZEB1 (n=15), and ZEB2 (n=9), (RPLP0 used as a reference gene) in MDA-MB-231 cells, 72 hours after treatment with either AdSLFN12 or AdCMV, data normalized to AdCMV group (*p<0.05). B) Protein levels of ZEB1(n=17), Snail (n=12), and Slug (n=12) analyzed by western blot of MDA-MB-231 cells with C) Representative western blot images, 72 hours after treatment with AdSLFN12 or AdCMV (*p<0.05). (GAPDH and β-actin used as reference proteins). D) SYBR Green qPCR analysis of SLFN12 mRNA levels (RPLP0 used as reference gene), (n=3, *p<0.05) and E) ZEB1 protein levels by western blot (GAPDH used as reference protein) in MDA-MB-231 cells 72 hours after treatment with either siSchlafen12 (siSLFN12) or non-targeting sequence (siNT), data normalized to siNT group, (n=12, *p<0.05) with F) Representative western blot images. G) SYBR Green qPCR analysis of ZEB1 mRNA levels and H) ZEB1 protein levels were analyzed by western blot in BT549 and Hs578T cells 72 hours after treatment with either AdSLFN12 or AdCMV, data normalized to AdCMV group (RPLP0 used as a reference gene and GAPDH as reference protein), (n=3-9, *p<0.05). I) Representative western blot images. All error bars shown represent standard error of mean.